![]()
|
|
|
© all pages from this
website are copyright PA0EHG
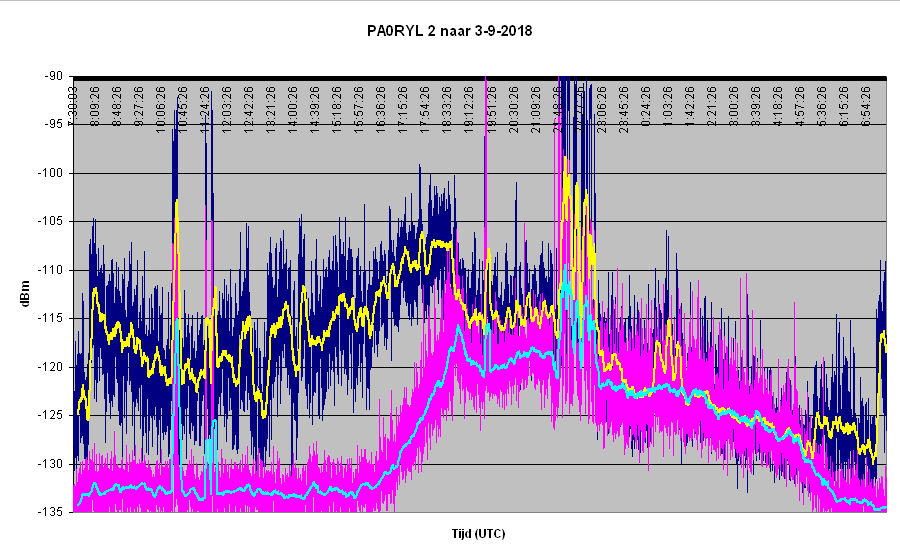
These are the results from my measurements: last update 03-10-2018 The Blue graph is the 17280 measuring points from the Beacon The Pink graph is the 17280 measuring points from the Noise The Yellow line is the averaged signal from the Beacon The Light Blue line is the averaged signal from the Noise
Thunderstorms over NL
Beacon US due to antenna problem, later switched to other antenna W3DZZ. signal about 3 to 5 dB stronger
Beacon still on W3DZZ antenna
Beacon back on repaired loop antenna at 07.45 UTC
ThunderStorm over NL
© all pages from this
website are copyright PA0EHG
|